TIL BDR GHALLEY | Thimphu
Bhutan’s merchandise trade expanded sharply in 2025, but the growth was driven overwhelmingly by imports, resulting in a trade deficit that is more than doubled within a year despite strong electricity export earnings, according to the official Bhutan Trade Statistics 2025 published by the Department of Revenue and Customs (DRC), Ministry of Finance.
The report shows that Bhutan’s total exports, including electricity, reached Nu. 69,732 million in 2025, while imports climbed to Nu. 190,113 million, producing a trade deficit of Nu. 120,381 million. This marks a dramatic widening compared to Nu. 58,679 million in 2024 and Nu. 55,502 million in 2023.
The data indicate that Bhutan’s trade deficit in 2025 is more than 105 percent higher than the previous year, representing the steepest single-year expansion in the country’s recent trade history.
When electricity trade is excluded, the imbalance becomes even more pronounced. Merchandise exports without electricity stood at Nu. 45,017 million, while imports reached Nu. 186,419 million, pushing the deficit to Nu. 141,402 million. The data highlights the critical role electricity plays in narrowing Bhutan’s overall trade gap. Without hydropower earnings, the deficit would be substantially larger.
India continued to dominate Bhutan’s trade structure in 2025. Total exports to India, including electricity, reached Nu. 59,948 million, while imports from India rose to Nu. 110,148 million, resulting in a bilateral trade deficit of Nu. 50,200 million.
Excluding electricity, exports to India amounted to Nu. 35,233 million against imports of Nu. 106,454 million, widening the merchandise deficit with India to Nu. 71,220 million. The figures show that Bhutan’s trade dependence on India deepened further during the year.
Trade with countries other than India (COTI) also expanded sharply but remained heavily imbalanced. Bhutan exported Nu. 9,784 million to non-Indian markets while importing Nu. 79,966 million, resulting in a deficit of Nu. 70,182 million. The surge in imports from non-Indian markets reflects growing procurement of machinery, electronics, fuel products, and industrial materials.
Electricity remained Bhutan’s single most valuable export commodity in 2025. The country exported 7,112.41 million units (MU) of electricity while importing 1,089.58 MU. Electricity export earnings reached Nu. 24,715.03 million, compared to electricity imports valued at Nu. 3,694.05 million.
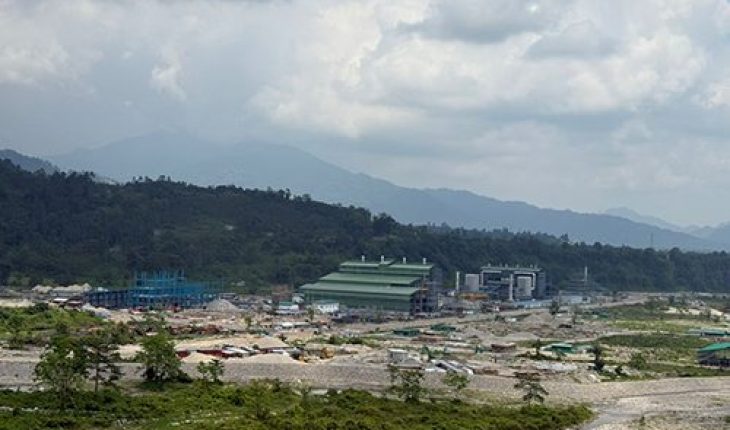
Major hydropower projects accounted for the bulk of electricity revenue. The Mangdechhu Hydroelectric Project contributed Nu. 12,943.29 million, followed by the Tala Hydroelectric Project at Nu. 4,432.12 million and the Chhukha Hydroelectric Project at Nu. 3,695.53 million. Additional contributions came from Nikachhu, Dagachhu, Kurichhu, and Basochhu projects. These earnings significantly offset what would otherwise be a much wider merchandise deficit.
Bhutan’s import profile in 2025 shows heavy concentration in machinery, electronics, fuel, construction materials, and staple food items.
The single largest import item was processing units (BTC 84715000) valued at Nu. 45.22 billion, making it the most significant contributor to the import bill. Fuel imports were also substantial. High-speed diesel reached Nu. 13.60 billion, while motor spirit (petrol) amounted to Nu. 5.22 billion. Imports of coke and semi-coke totaled Nu. 3.61 billion.
Electronics imports surged, with smartphones alone valued at Nu. 3.58 billion. Food imports remained significant, with semi- or wholly milled rice worth Nu. 2.73 billion. Industrial materials such as ferrous products reached Nu. 2.57 billion, while electrical control panels added Nu. 2.55 billion to the import bill.
On the export side, Bhutan’s earnings were concentrated in mineral and metal products. Ferrosilicon containing over 55 percent silicon led all exports at Nu. 15.27 billion. This was followed by dolomite chips valued at Nu. 3.17 billion, ferro-silico-manganese at Nu. 2.93 billion, and stone boulders at Nu. 2.73 billion.
Other major export items included additional ferrosilicon products worth Nu. 2.57 billion, cardamom at Nu. 2.04 billion, and crushed stone and aggregates at Nu. 1.95 billion. Gypsum exports reached Nu. 1.51 billion, while dolomite lumps and slabs and beer made from malt each contributed about Nu. 1.16 billion each.
These data show that Bhutan’s export basket remains highly concentrated in a narrow range of mineral, alloy, and agricultural commodities.
Imports by Bhutan Trade Classification (BTC) section reveal that machinery and electrical equipment covered under (Section 16, which includes machinery and mechanical appliances, electrical equipment and their parts, as well as sound and television recording and reproducing equipment) accounted for Nu. 82.13 billion, representing nearly half of Bhutan’s total imports.
Imports were led by mineral products, which accounted for Nu. 29.16 billion, followed by base metals at Nu. 15.44 billion. Vehicles and transport equipment contributed Nu. 9.92 billion, while vegetable products and prepared foodstuffs added Nu. 7.77 billion and Nu. 7.54 billion, respectively.
Exports, on the other hand, were heavily concentrated in a few categories. Base metals dominated with Nu. 22.46 billion, followed by mineral products at Nu. 13.89 billion. Smaller contributions came from vegetable products (Nu. 3.49 billion), prepared foodstuffs (Nu. 2.73 billion), and wood and wood products (Nu. 1.16 billion).
The section breakdown highlights a structural gap between high-value machinery imports and resource-based exports. Trade activity remained concentrated at Bhutan’s major southern border gateways, with the Phuntsholing Regional Revenue and Customs Office (RRCO) accounting for the largest share of national trade.
Exports and imports through the country’s main trade hubs showed robust activity, with Phuntsholing and Gelephu handling the highest volumes.
Overall, total exports across all RRCOs reached Nu 35.23 billion to India and Nu 9.78 billion to other countries, while imports totaled Nu 106.48 billion from India and Nu 79.94 billion from other countries.
Bhutan imported goods from 48 countries, with India as the largest source, followed by Singapore at Nu 32.38 billion, China at Nu 21.05 billion, Vietnam at Nu 8.89 billion, Malaysia at Nu 3.35 billion, and Thailand at Nu 2.86 billion.
On the export side, Bhutan shipped goods to 29 countries. India remained the primary destination with Nu. 35.23 billion in non-electricity exports. Bangladesh followed with Nu. 6.20 billion, while additional destinations included the United States, South Korea, Nepal, the Netherlands, Italy, Turkey, Thailand, and the United Arab Emirates.
The DRC states that all trade statistics are compiled through the electronic Customs Management System (eCMS), operational nationwide since 2014. The platform enables standardized eight-digit commodity classification, real-time reporting, and cross-validation across regional customs offices.
According to the department, the system has strengthened transparency, reduced processing time, and improved the accuracy of national trade reporting, making the publication a central reference for policymakers, researchers, and businesses.